
Execution Gap Analysis shows how consistently your outlets deliver on the questions that matter to you. For each custom question you choose, it compares your highest-scoring and lowest-scoring outlets, so you can see where performance is consistent and where it varies.
You'll find it in the Custom questions section of TruHub.
What is an execution gap?
The execution gap is the difference, in percentage points, between your highest-scoring and lowest-scoring outlet for a question, not counting outlying outlets (outlets with unusually high or low scores -see "Outlying outlets" below).
For example, if your best outlet scores 88.24% and your lowest scores 6.56%, the execution gap is 81.68%.
• A small gap means customers get a similar experience across your estate.
• A large gap means the experience varies a lot from outlet to outlet. That's usually where there's most to learn from your best outlets and most to fix in your weakest.
Reading the chart
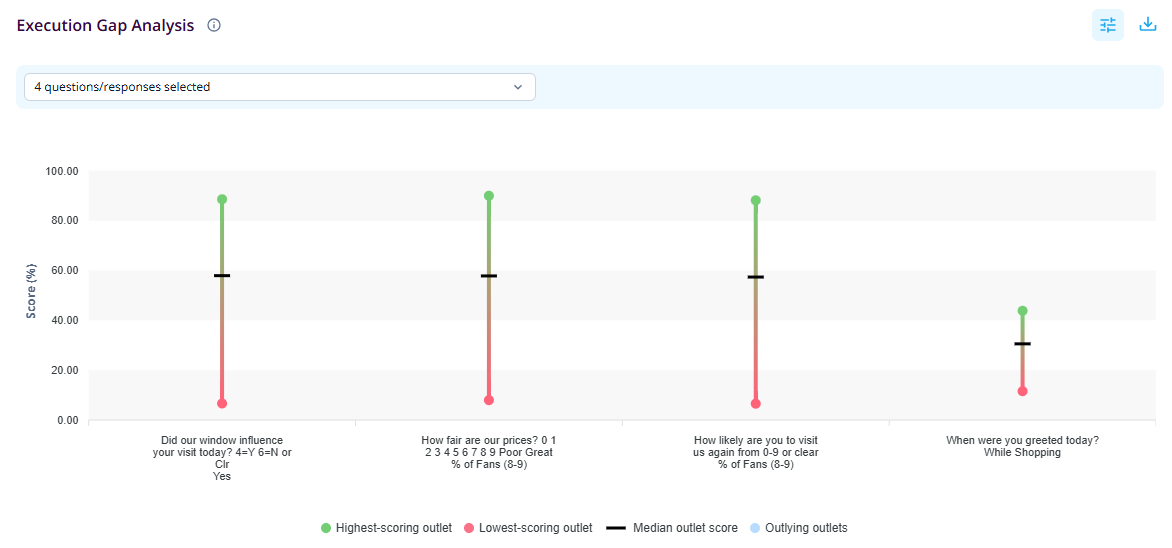
Each question or response you select appears as a vertical bar, with scores shown as a percentage on the vertical axis. If you select more questions and responses than fit on your screen at once, scroll horizontally to view the rest.
• Green dot: the highest-scoring outlet
• Red dot: the lowest-scoring outlet
• Black line: the median outlet score. Half your outlets score above this line and half below.
• Light blue dot: outlying outlets (see "Outlying outlets" below)
The longer the bar, the bigger the gap. A median line close to the top of the bar means most outlets are performing well, with a few lagging behind. A median near the bottom means the problem is widespread.
Every outlet counts equally in these calculations, whatever its number of ratings. This means the median line is the median of outlet scores, so it won't necessarily match the overall percentage you see elsewhere in TruHub.
Hover for more detail
Hover over any bar to see a summary for that question:
• The question and response being measured
• The score of the highest-scoring outlet
• The score of the lowest-scoring outlet
• The median outlet score
• The execution gap
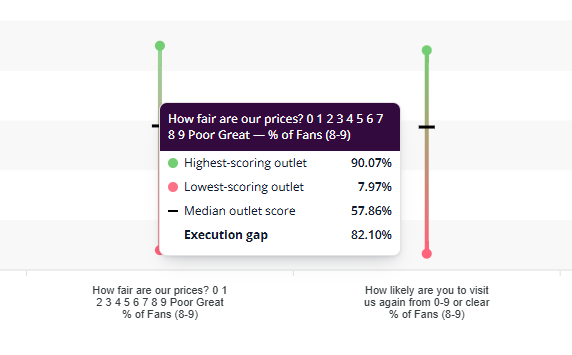
The tooltip shows scores only. To see which outlets are at the top and bottom, use the tables below the chart.
Outlying outlets are always shown on the chart as light blue dots. Hover over one to see the outlet's name and score.
Choosing which questions to analyse
You can compare response options across question types. Since a scale question score doesn't sit on the same axis as, say, the percentage of Yes responses, scale questions here are measured by segment: % of Fans (8-9), % of Indifferent (6-7) or % of Disappointed (0-5).
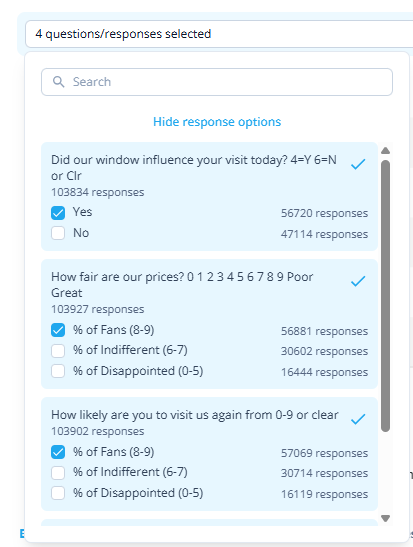
1. Open the dropdown at the top of the chart. It shows how many questions/responses are currently selected.
2. Tick the questions and responses you want to compare. For each question, you choose which response to measure, for example Yes for a yes/no question, or % of Fans (8-9) for a scale question. The number of responses behind each option is shown next to it.
3. Use the search box to find a question quickly, and select Hide response options to collapse the list.
Like the rest of your Custom questions data, the analysis follows your active filters.
The dropdown shows how many responses each question and response option has received, so use it wisely to check there's enough data behind the questions and responses you select. Results based on very few responses are less reliable.
Three ways to explore the results
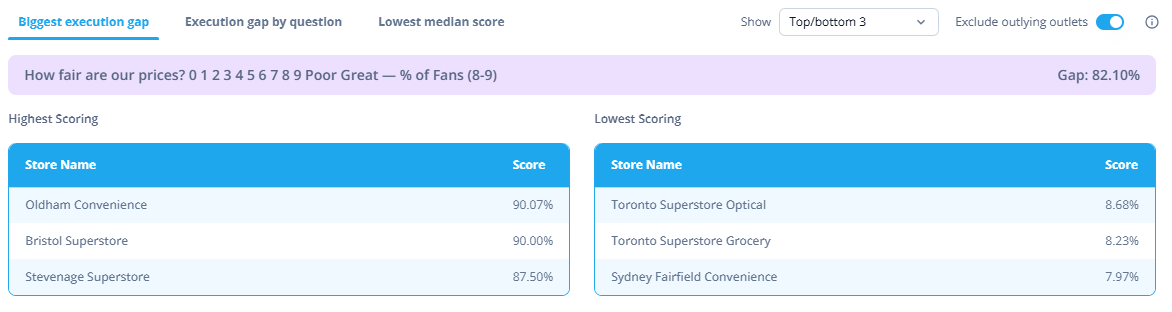
Under the chart, three tabs help you pinpoint where to focus. Each shows your highest-scoring outlets on the left and your lowest-scoring on the right.
1. Biggest execution gap
Shows the question with the widest gap between its best and worst outlet, out of the questions you've selected. Start here to find where consistency is the biggest issue.
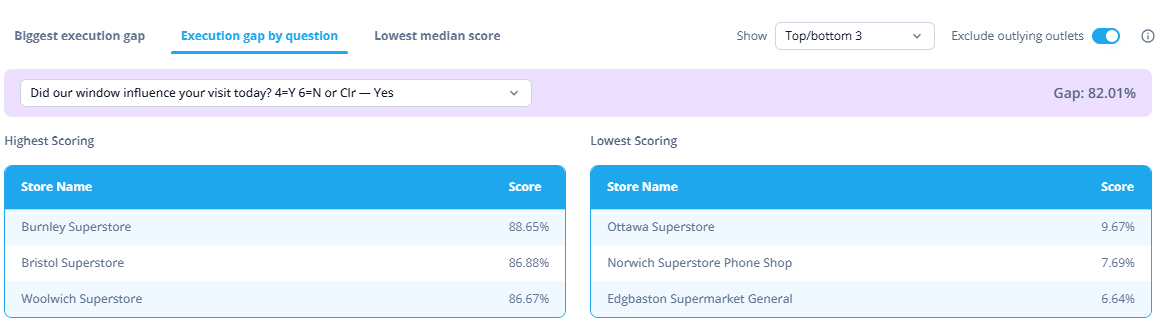
2. Execution gap by question
Choose any selected question from the dropdown to see its gap and its top and bottom outlets. Use this when you already know which question you want to dig into.
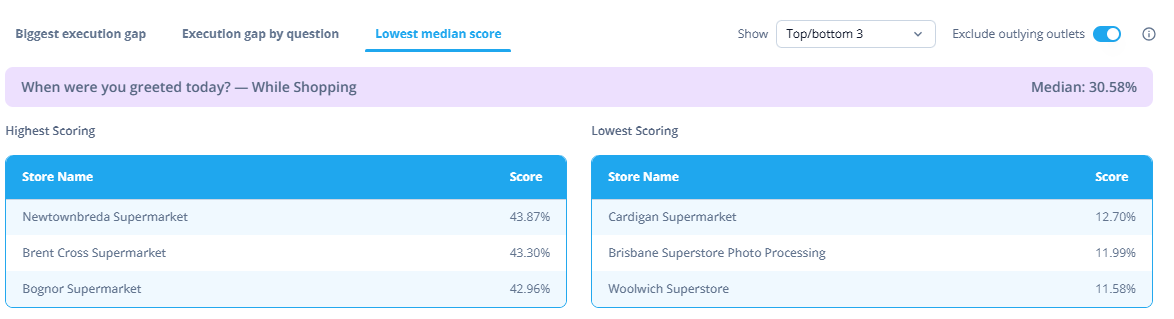
3. Lowest median score
Shows the question with the lowest median outlet score. This highlights where performance is weak across the board, not just in a few outlets. A question can have a small gap and still score poorly everywhere.
Outlying outlets
Outlying outlets are those whose scores sit unusually far from the rest of the outlets you're viewing. They're identified using a standard statistical method (the 1.5 × interquartile range rule), separately for each question and response you select. Both unusually high and unusually low scores count, so outliers can include your very best and your very worst outlets. If they were included in the range, they could make the gap look bigger than it really is.
By default, Exclude outlying outlets is switched on. The chart and the highest and lowest scoring tables then show realistic top and bottom outlets across your estate.
Outlying outlets appear on the chart as light blue dots, and you can hover over one to see which outlet it is and its score.
Switch the toggle off if you want these outlets included in the highest and lowest scoring tables.
Tips
• Learn from your top outlets. Their practices may be worth sharing with the outlets at the bottom.
• Look at the gap and the median together. A large gap tells you about consistency, and a low median tells you about overall performance.
• Check the response counts in the dropdown before drawing conclusions. A question with few responses can show a wide gap that reflects a handful of customers rather than a real difference between outlets.
• Hover over an outlying outlet to find out which outlet it is. An unusually high or low score is often worth investigating separately.